NCERT Class 10 Mathematics Solutions
Chapter 13: Statistics
Get FreeEx 14.1 PDF. Statistics Class 10 Maths NCERT Solutions are extremely helpful while doing your homework. Exercise 14.1 Class 10 Maths NCERT Solutions were prepared by ExperiencedTeachers. Detailed answers of all the questions in Chapter 14 MathsClass 10 StatisticsExercise 14.1 provided in NCERT TextBook.
Topics and Sub Topics in Class 10 Maths Chapter 14 Statistics:
Section Name | Topic Name |
14 | Statistics |
Question 1 (14)
1 | Introduction |
14.2 | Mean Of Grouped Data |
14.3 | Mode Of Grouped Data |
14.4 | Median Of Grouped Data |
14.5 | Graphical Representation Of Cumulative Frequency Distribution |
14.6 | Summary |
- Statistics Class 10 Ex 14.1
- प्रश्नावली 14.1 का हल हिंदी में
- Statistics Class 10 Ex 14.2
- प्रश्नावली 14.2 का हल हिंदी में
- Statistics Class 10 Ex 14.3
- प्रश्नावली 14.3 का हल हिंदी में
- Statistics Class 10 Ex 14.4
- प्रश्नावली 14.4 का हल हिंदी में
- Statistics Class 10 Extra Questions
Board | CBSE |
Textbook | NCERT |
Class | Class 10 |
Subject | Maths |
Chapter | Chapter 14 |
Chapter Name | Statistics |
Exercise | Ex 14.1 |
Number of Questions Solved | 9 |
Category | NCERT Solutions |
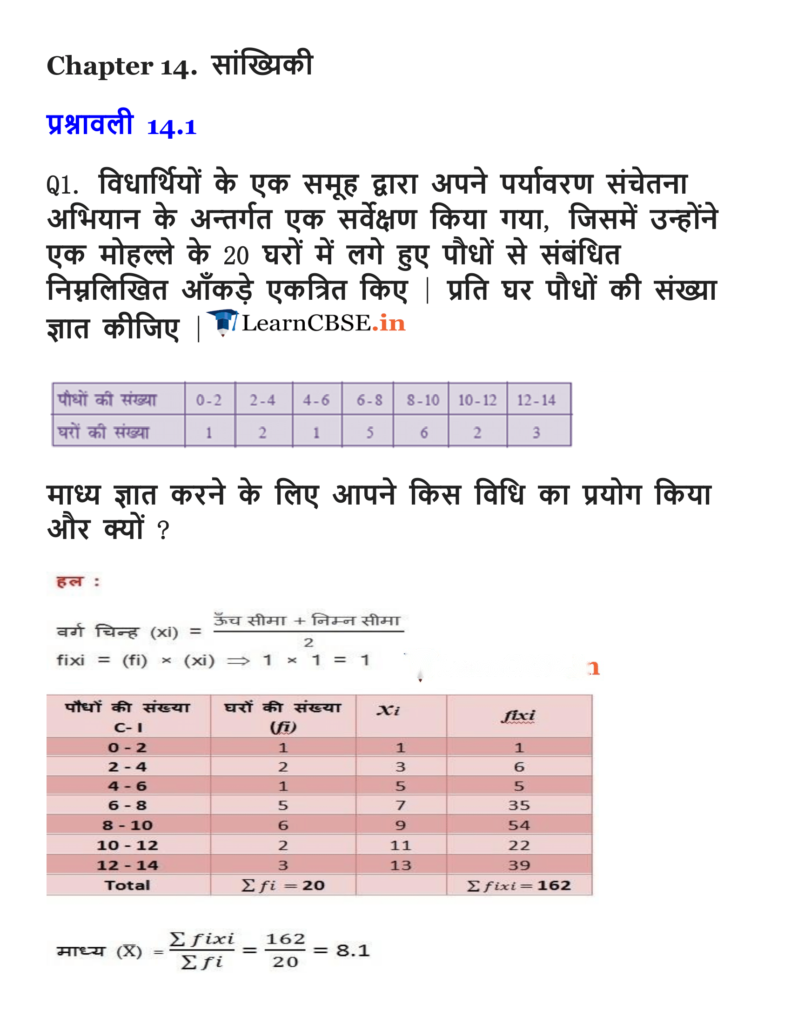
Ex 14.1 Class 10 Maths Question 1.
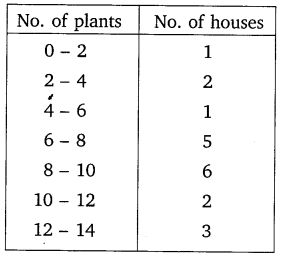
A survey was conducted by a group of students as a part of their environment awareness programme, in which they collected the following data regarding the number of plants in 20 houses in a locality. Find the mean number of plants per house.
Which method did you use for finding the mean, and why?

You can also download the free PDF of Ex 14.1 Class 10 Statistics NCERT Solutions or save the solution images and take the print out to keep it handy for your exam preparation.
Ex 14.1 Class 10 Maths Question 2.
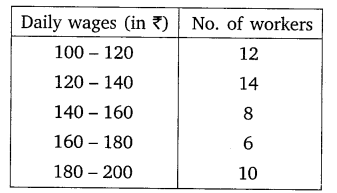
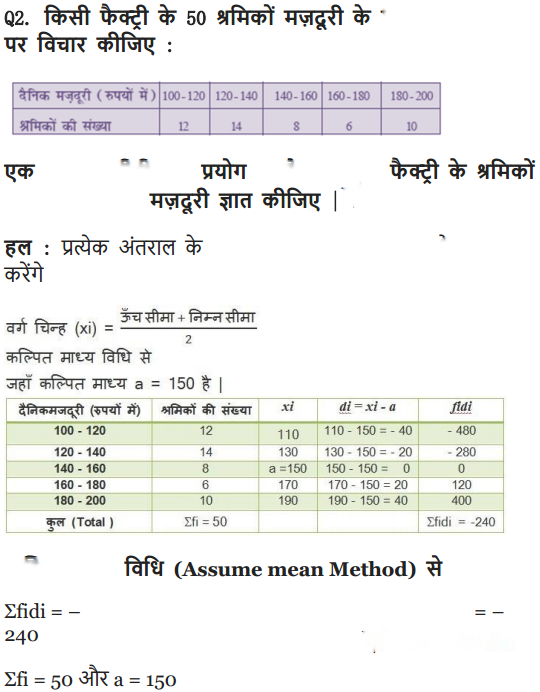
Consider the following distribution of daily wages of 50 workers of a factory.
Find the mean daily wages of the workers of the factory by using an appropriate method.
Solution:

Ex 14.1 Class 10 Maths Question 3.
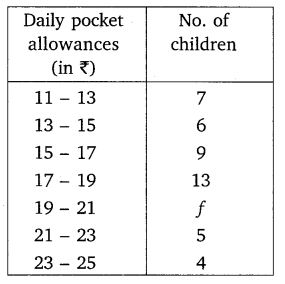
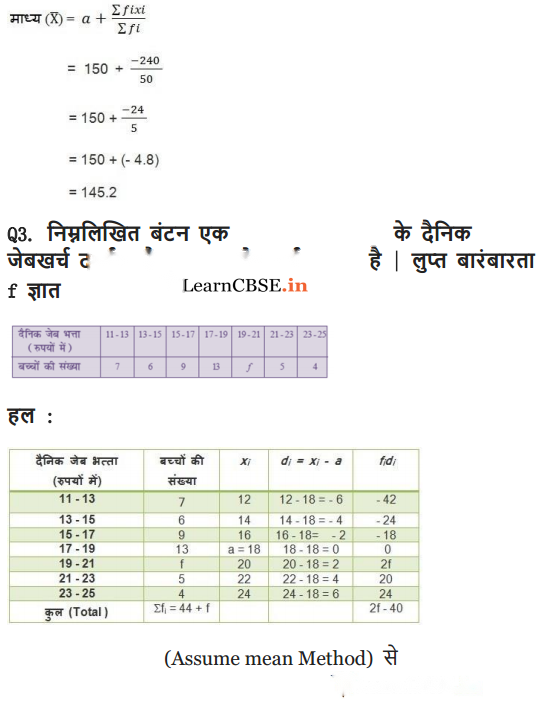
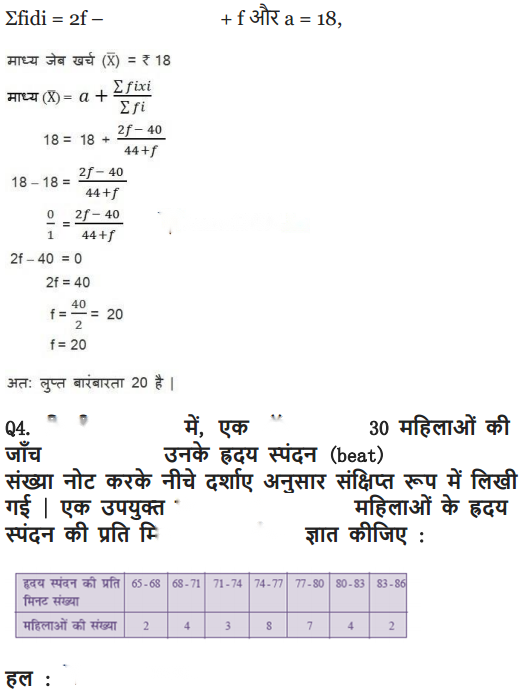
The following distribution shows the daily pocket allowance of children of a locality. The mean pocket allowance is ₹ 18. Find the missing frequency f.
Solution:

Ex 14.1 Class 10 Maths Question 4.
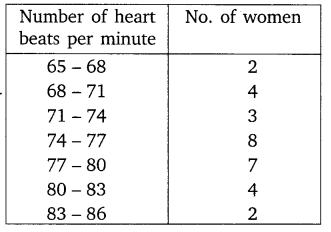
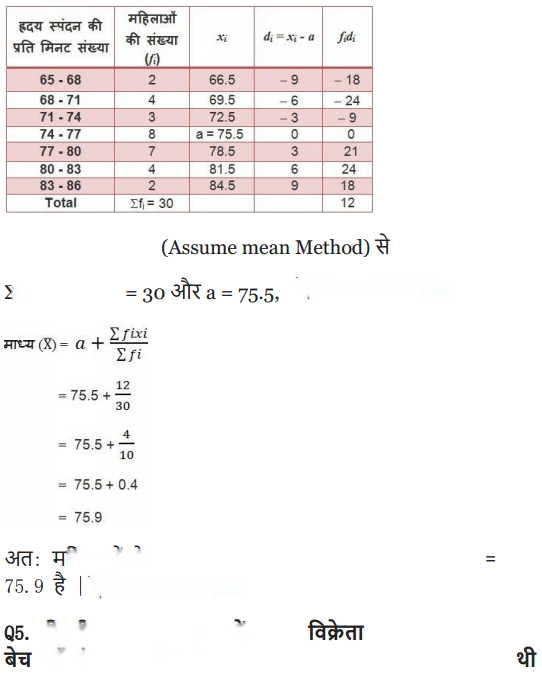
Thirty women were examined in a hospital by a doctor and the number of heart beats per minute were recorded and summarised as follows. Find the mean heart beats per minute for these women, choosing a suitable method
Solution:

Ex 14.1 Class 10 Maths Question 5.
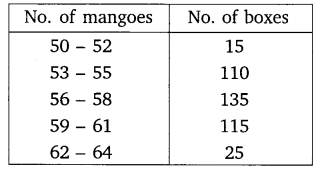
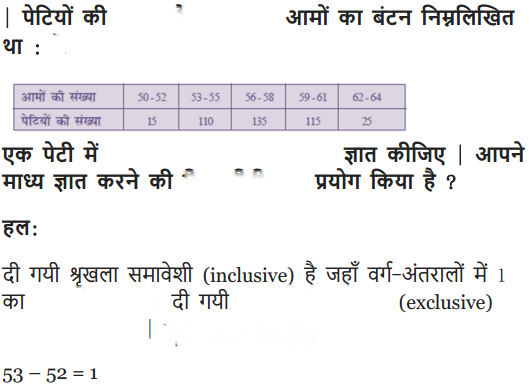
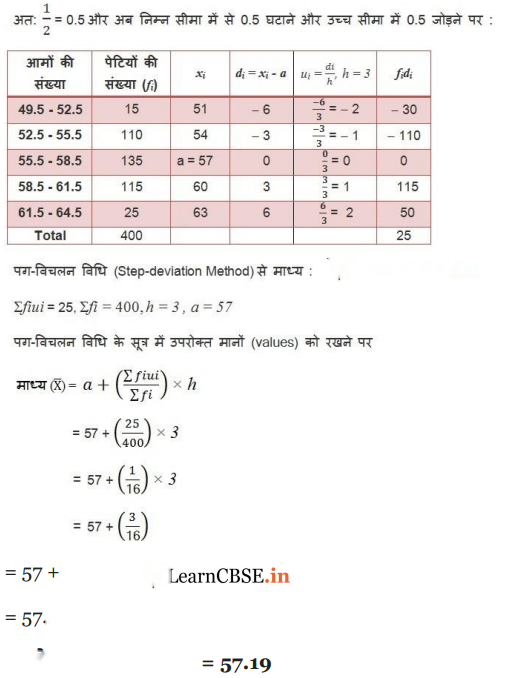
In a retail market, fruit vendors were selling mangoes kept in packing boxes. These boxes contained varying number of mangoes. The following was the distribution of mangoes according to the number of boxes.
Find the mean number of mangoes kept in a packing box. Which method of finding the mean did you choose?
Solution:

Ex 14.1 Class 10 Maths Question 6.
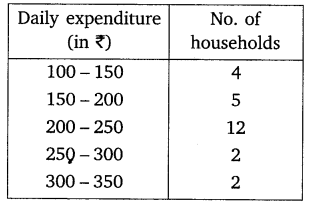
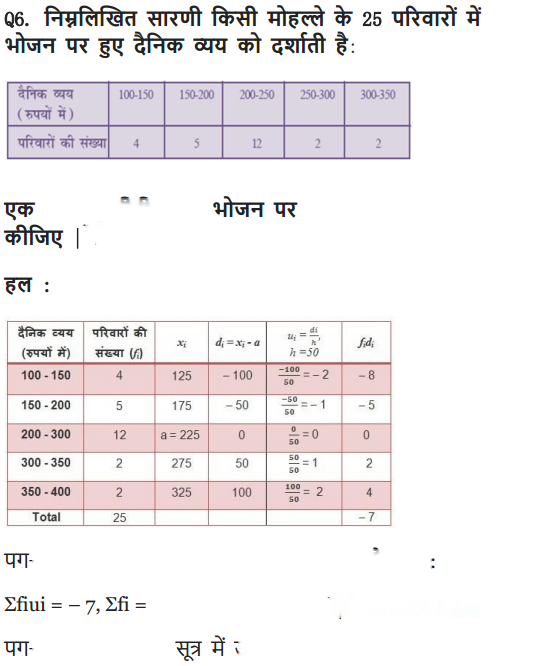
The table below shows the daily expenditure on food of 25 households in a locality.
Find the mean daily expenditure on food by a suitable method.
Solution:

Ex 14.1 Class 10 Maths Question 7.
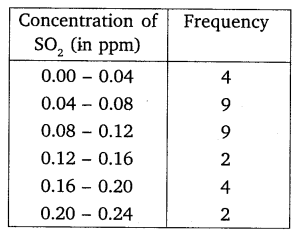
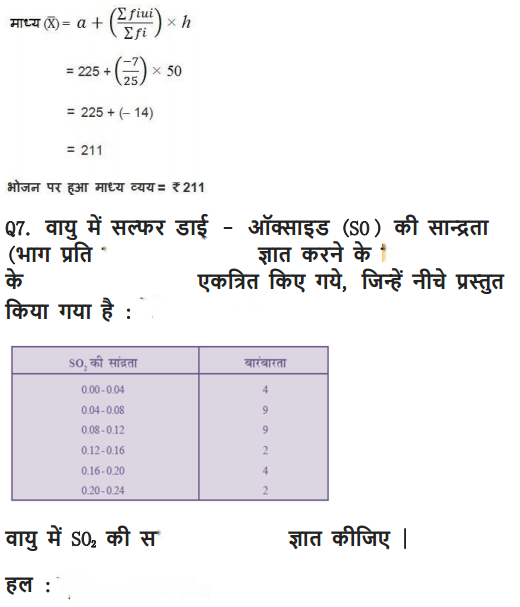
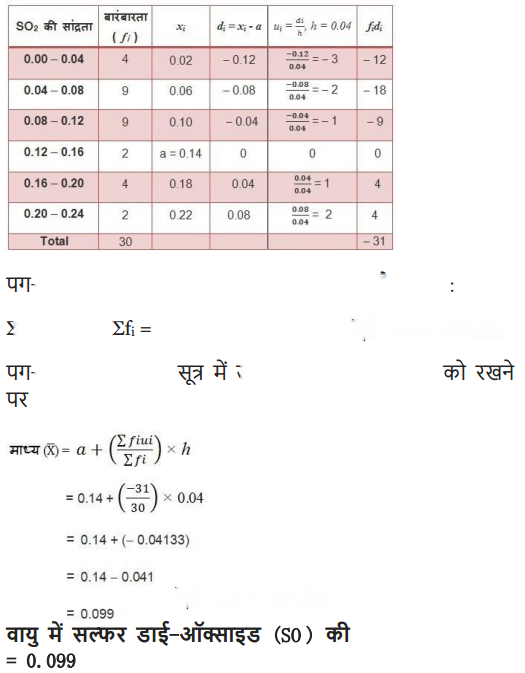
To find out the concentration of SO2 in the air (in parts per million, i.e. ppm), the data was collected for 30 localities in a certain city and is presented below:
Find the mean concentration of SO2 in the air.
Solution:

Ex 14.1 Class 10 Maths Question 8.
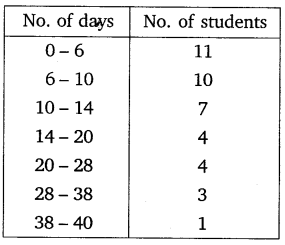
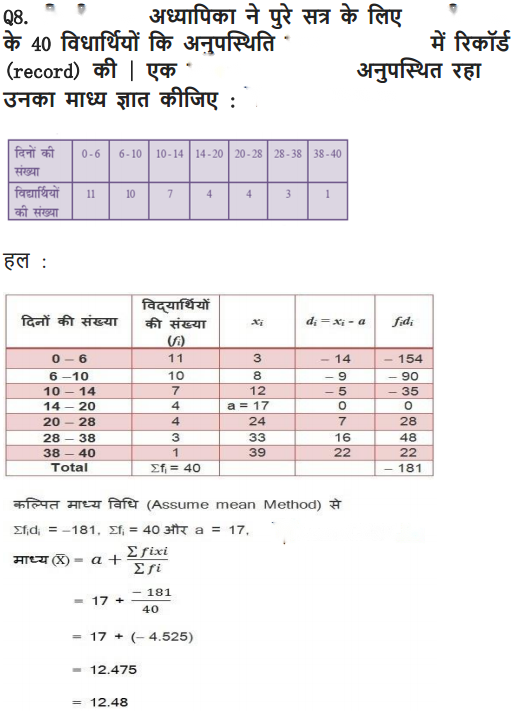
A class teacher has the following absentee record of 40 students of a class for the whole term. Find the mean number of days a student was absent.
Solution:

Ex 14.1 Class 10 Maths Question 9.
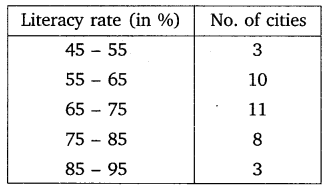
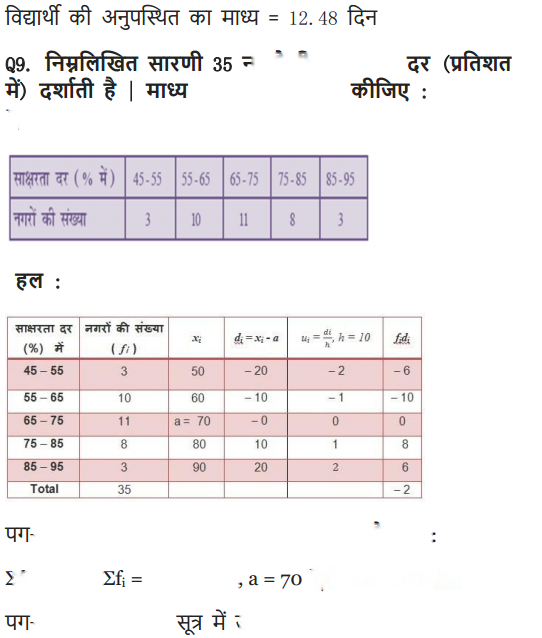
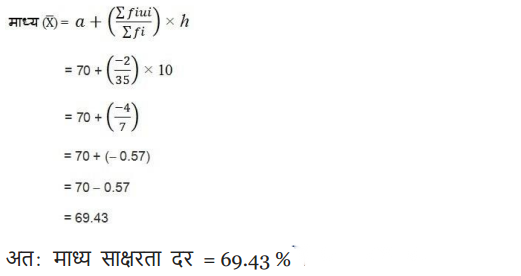
The following table gives the literacy rate (in percentage) of 35 cities. Find the mean literacy rate.
Solution:

Class 10 Maths Statistics Mind Maps
Basic Terms
Class limits: Suppose mark obtained by all of the students are divided into class intervals 25 – 35, 35 – 45 and so interval on.
In class interval 25 – 35, 25 is called lower class limit and 35 is called upper class limit.
Class size: The difference between upper and lower class limit.
Class mark: It is given by
Ungrouped and Grouped Data
The data obtained in original form are called raw data or ungrouped data.
To put the data in a more condensed form, we make groups of suitable size, and mention the frequency of each group. Such a table is called grouped data.
Mean
For Ungrouped:
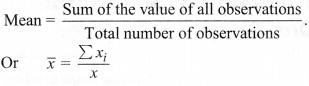
Consider ‘n’ observations in ungrouped data as : x1, x2, x3, …. xn. The mean of these observations is:
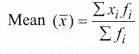
(i) Direct method:
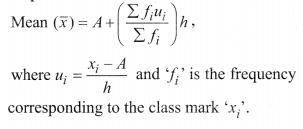
where ‘fi‘ is the frequency corresponding to the class mark ‘xi‘
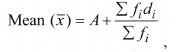
(ii) Assumed mean method:
Where A is assumed mean and di= xi– A
(iii) step deviation method:

Mode
(i) For Ungrouped Data:
The mode is that observation which occurs most frequently, i.e., an observation with maximum frequency.
(ii) For Grouped Data:
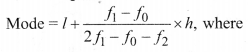
l =lower limit of the modal class,
f1= frequency of the modal class
f2= frequency of the class suceeding the modal class,
h = size of the class interval,
f0= frequency of the class preceeding the modal class.
The class with the maximum frequency is called modal class.
Median
Median is a measure of central tendency which gives the value of the middle-most observation in the data.
(i) For Ungrouped Data:
Arrange the data in ascending order.
If number of data n is odd, then the median is ≤ft(\right)^{t h}\) observation.
If number of data n is even, then the median is the average of ≤ft()^{t h} and ≤ft(+1\right)^{t h}\) observations.
(ii) For Grouped Data:
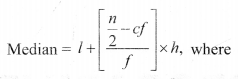
l = lower limit of the median class,
c.f = cumulative frequency of the class proceeding the median class,
f = frequency of the median class,
h = class size,
n = number of observations.
The class whose cumulative frequency is greater than (and nearest to) is called median class.
Relationship Between Mean, Mode and Median
3 Median = Mode + 2 Mean
Cumulative Frequency Curve (Ogive)
(i) The smooth free hand curve is formed by joining the points (xi, fi) where x; is the upper limit of a class and f is the corresponding c.f. The curve so obtained is called a cumulative frequency curve, or an ogive of the less than type.
(ii) The smooth free hand curve is formed by joining the points (xi, fi) where Xiis the lower limit of a class and f is the corresponding c.f. The curve so obtained is called a cumulative frequency curve, or an ogive of the more than type.
Median by Graph
(i) Draw the ogive of the less than type and ogive of the more than type on the same axis. The two ogives will intersect each other at a point. From this point, if we draw a perpendicular on the x-axis, the point at which it cuts the x-axis gives us the median.
(ii) Draw the ogive of the less than type, then locate on the y-axis (n = number of observations).
From this point on y-axis, draw a line parallel to x-axis cutting the less than ogive at a point. From this point draw a perpendicular on the x-axis, the point at which the perpendicular cuts the x-axis gives us the median.
Ex 14.1
We hope the