NCERT Class 4 Mathematics (Maths Mela) Solutions
Chapter 14: Data Handling
Students can use Class 4 Maths Solutions and Maths Mela NCERT Class 4 Maths Chapter 14 Data Handling Question Answer Solutions to explore alternative problem-solving methods.
Class 4 Maths Chapter 14 Data Handling Question Answer Solutions
Data Handling Class 4 Maths Solutions
Class 4 Maths Chapter 14 Solutions
NCERT Textbook Pages 203-205
Look at the questions asked by Rohan and Anjali.
Tick the question that is the most appropriate for finding the ‘most liked subject’. Why do you think so? Discuss with your friends and teacher.
Solution:
Do it yourself.
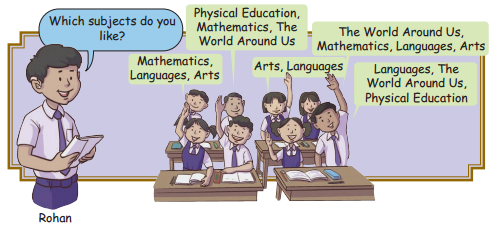
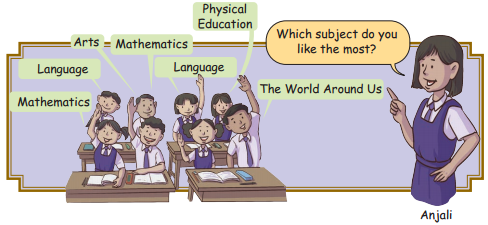
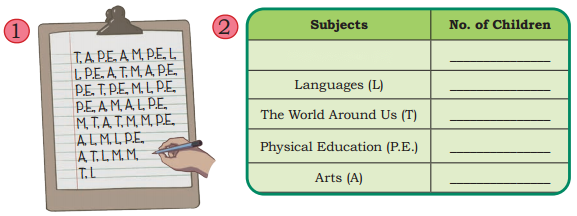
Anjali and Rohan recorded the children’s answers (responses) to the above question as follows:
They wrote M for Mathematics, L for Languages, T for the World Around Us, A for Arts and P.E. for Physical Education.
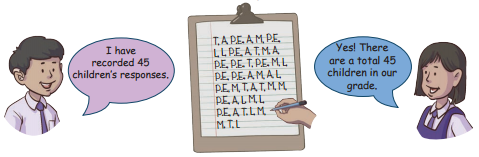
Look at the children’s responses above and answer the following questions:
- The number of children who like Mathematics the most is ________.
- The number of children who like Language the most is ________.
- The number of children who like The World Around Us the most is ________.
- The number of children who like Physical Eduation the most is ________.
- The number of children who like Arts the most is ________.
- The number of children who like Mathematics the most is 10.
- The number of children who like Language the most is 8.
- The number of children who like The World Around Us the most is 7.
- The number of children who like Physical Education the most is 11.
- The number of children who like Arts the most is 9
Let’s fill the above information in this table.
Solution:
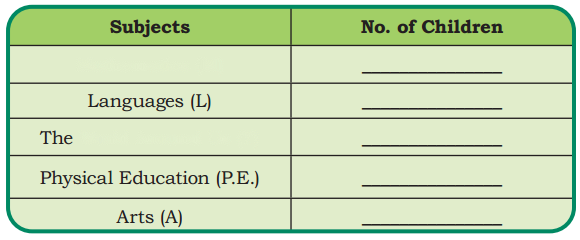
Subjects | No. of Children |
Mathematics (M) | 10 |
Languages(L) | 8 |
The World Around Us (T) | 7 |
Physical Education (P.E.) | 11 |
Arts (A) | 9 |
Now, look at the above table and answer the following questions:
What is the most common favourite subject among the children?
Solution:
Physical Education
What is the least common favourite subject among the children?
Solution:
Languages
There are the following two ways to display information.
Which way of displaying information is easier to understand and why? __________
Solution:
The tabular form (second method) is better to understand because it is more organised and makes it easier to compare numbers quickly.
NCERT Textbook Pages 206-207
Colourful Golas
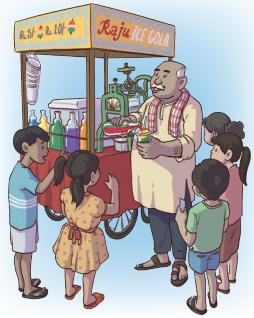
During school lunch break children rush to eat gola of their favourite colour.
Rohan and Anjali record the golas eaten by different children. They want to eat the one that is most eaten by others.
They both start recording the golas eaten by the children.
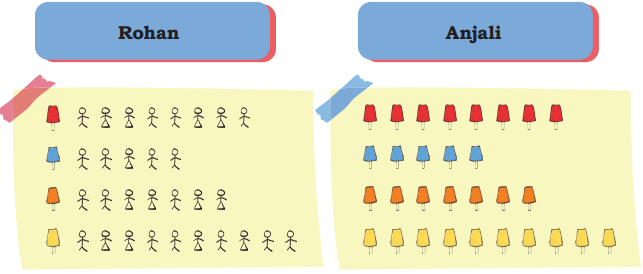
Look at the information given above. Colour the line drawing of the gola appropriately.
Which colour ice gola do the children eat:
a) the most
b) the least
How do you know?
Solution:
(a) Yellow
By counting, we get Red golas-9, Blue golas-5, Orange-7, Yellow golas-10
Which colour gola would Anjali and Rohan have bought?
Solution:
They would like to buy yellow gola, as it is the most popular.
Which colour golas did boys eat the most?
Solution:
Yellow
Which colour golas did girls eat the most?
Solution:
Red, Orange and Yellow
Which of the ways of representing data did you use to answer these questions and why?
Solution:
By using pictograph and counting the numbers we get the answer. It helps us to get the answer quickly and in easier way.
NCERT Textbook Page 208 Bal Mela
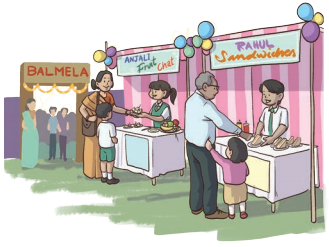
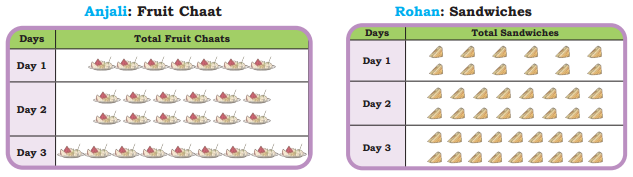
Anjali and Rohan have recorded the number of people who ate fruit chaats and sandwiches in the Bal Mela over three days, using a Pictograph.
Let Us Do
Complete the table.
Solution:

Items | Total Sold Items |
Fruit Chats | 28 |
Sandwiches | 46 |
On which day was the most sandwiches sold?
Solution:
Day 3
Which item had the highest sale on Day 2?
Solution:
Sales of fruit chaats on day 2 = 12
Sales of sandwiches on day 2 = 16
The difference in the sales of both items = 16 – 12 = 4.
Hence, sandwiches had the highest sale on day 2.
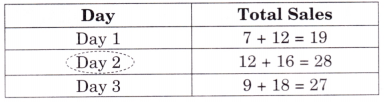
Complete the table given below. Circle the day that had the highest sales.
Solution:
Day 2 had the highest sale.

CBSE 2026-27 Board Exam Preparation & Practice Papers
Free Chapter Notes & Question Bank by BoardExams.in