NCERT Class 9 Science (Exploration) Solutions
Chapter 4: Describing Motion Around Us
Chapter-wise
Class 9 Science Exploration Chapter 4 Question Answer
Class 9 Science Ch 4 Describing Motion Around Us Question Answer
Describing Motion Around Us Class 9 Questions and Answers (Exercise)
Revise, Reflect, Refine (NCERT Textbook Page No. 68)
My father went to a shop from home which is located at a distance of 250 m on a straight road. On reaching there, he discovered that he forgot to carry a cloth bag. He came home to take it, went to the shop again, bought provisions and came back home. How much was the total distance travelled by him? What was his displacement from home?
Answer:
Let us trace the journey step by step.
Journey 1: Home to Shop = 250 m
Journey 2: Shop to Home = 250 m
Journey 3: Home to Shop = 250 m
Journey 4: Shop to Home = 250 m
Total distance travelled = 250 + 250 + 250 + 250 = 1000 m
Displacement = final position – initial position
His father started from home and ended at home.
So his initial position and final position are the same.
Displacement = 0 m.
A student runs from the ground floor to the fourth floor of a school building to collect a book and then comes down to their classroom on the second floor. If the height of each floor is 3 m, find:
(i) the total vertical distance travelled, and
(ii) their displacement from the starting point.
Answer:
Height per floor: 3 m
Phase 1: Ground Floor to 4th Floor
The student climbs 4 floors.
Distance Up = 4 × 3 = 12 m
Phase 2: 4th Floor to 2nd Floor
The student descends 2 floors (from 4 down to 2)
Distance Up 2 × 3 = 6 m
(i) Total vertical distance = 12 + 6 = 18 m
(ii) Displacement:
The student’s final position is the 2nd floor, relative to the ground floor.
Displacement (upwards) = 2 floors × 3 m = 6 m
A girl is riding her scooter and finds that its speedometer reading is constant. Is it possible for her scooter to be accelerating, and if so, how?
Answer:
Yes, it is possible. The speedometer measures speed (a scalar quantity), which is the magnitude of velocity. Acceleration is the rate of change of velocity (a vector quantity). If the girl rides at a constant speed along a curved or circular path, her direction of motion is continuously changing. This change in direction means her velocity is changing, which requires acceleration.
A car starts from rest and its velocity reaches 24 ms-1 in 6 s. Find the average acceleration and the distance travelled in these 6 s.
Answer:
Given:
Initial velocity, u = 0 m/s (starts from rest)
Final velocity, ν = 24 m/s
Time, t = 6 s
Average acceleration:
a = (v- u)/t = (24 -0)/ 6 = 4 m/s2
∴ Average acceleration = 4 m/s2
Distance travelled:
S = (v2-u2)/(2a) (242 – 0)/(2 × 4) = 576/8
= 72 m
Alternatively, using s = ut + at2
s=0+ × 4 × 62 = 2 × 36=72m
∴ Distance travelled = 72 m
A motorbike moving with initial velocity 28 ms-1 and constant acceleration stops after travelling 98 m. Find the acceleration of the motorbike and the time taken to come to a stop.
Answer:
Given: Initial velocity, u = 28 ms-1,
Final velocity, v = 0 ms-1 (it stops),
Distance, s = 98 m
Using the equation: v2 = u2 + 2as
02 = 282 + 2 × a × 98
⇒ 0 = 784 + 196a
⇒ – 196a = 784
⇒ a =
⇒ a = – 4 ms-2
The negative sign means the acceleration is opposite to the direction of motion or velocity (deceleration/ retardation).
The magnitude of acceleration is 4 ms-2.
Using the equation: v = u + at
⇒ 0 = 28 + (- 4) × t
⇒ 4t = 28
⇒ t =
⇒ t = 7 s
The acceleration of the motorbike is – 4 ms-2 (retardation of 4 ms-2) and the time taken to stop is 7 s.
Fig. 4.27 shows a position-time graph of two objects A and B that are moving along the parallel tracks in the same direction. Do objects A and B ever have equal velocity? Justify your answer.
Answer:
In a position-time graph, the slope (gradient) of the curve at any point gives the instantaneous velocity of the object.
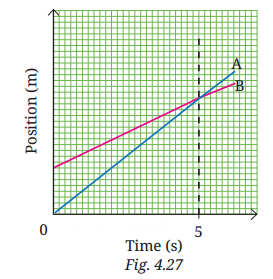
From Fig. 4.27:
- Object A: The position-time graph is a straight line with a steeper slope A moves at a higher constant velocity.
- Object B: The graph is also a straight line but with a gentler slope B moves at a lower constant velocity.
Since both lines are straight (constant slopes) and their slopes are different, the velocities of A and B are constant but unequal at all times. The two lines appear to intersect at one point (around t = 5 s). At this point, their positions are equal, but not their velocities (slopes are still different). Velocity is the slope, not the position. So, no objects A and B never have equal velocity. Their velocity remains different throughout the motion.
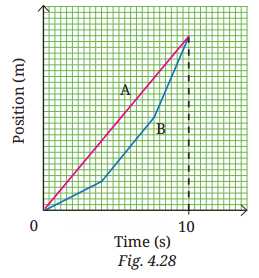
A graph in Fig. 4.28 shows the change in position with time for two objects, A and B, moving in a straight line from 0 to 10 seconds. Choose the correct option(s).
(i) The average velocity of both over the 10s time interval is equal since they have the same initial and final positions.
(ii) The average speeds of both over the 10s time interval are equal since both cover equal distances in equal time.
(iii) The average speed of A over the 10 s time interval is lower than that of B since it covers a shorter distance than B in 10 seconds.
(iv) The average speed of A over the 1st time interval is greater than that of B since B’s speed is lower than A’s in some segments.
Answer:
(i) is correct: both objects start and end at the same positions, so their average velocities are equal.
(ii) is also correct: since displacement over equal time is the same, the average speeds match.
(iii) is incorrect: A does not cover less distance than B; both end at the same position.
(iv) is incorrect: average speed depends on total distance, not instantaneous segments.
Correct options: (i) and (ii).
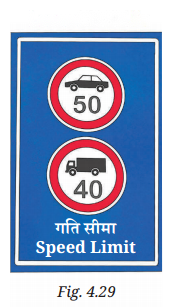
A truck driver driving at the speed of 54 km h-1 notices a road sign with a speed limit of 40 km h-1 (Fig. 4.29) for trucks. He slows down to 36 km h-1 in 36 s. What was the distance travelled by him during this time? Assume the acceleration to be constant while slowing down.
Answer:
Since the acceleration is constant, the simplest way to find the distance (s) is by using the average velocity formula:
s = ≤ft() × t
First convert speed into m/s
u = 54km/hr = 15 m/s
v = 36 km/hr = 10 m/s
t = 36 s
Substituting the values:
s = ≤ft() × 36
s = ≤ft() × 36
s = 12.5 × 36
s = 450 m
A car starts from rest and accelerates uniformly to 20 ms-1 in 5 seconds. It then travels at 20 ms-1 for 10 seconds and finally applies the brake (with uniform acceleration) to stop in 6 seconds. Find the total distance travelled.
Answer:
Phase 1: Acceleration (0 to 20 m/s in 5 s)
Given: u = 0 ms-1
v= 20 m/s
S1 = ≤ft() × 5 = 10 × 5 = 50m
Phase 1: Constant speed (20 m/s for 10 s)
S2 = 20 × 10 =200m
Phase 3: Deceleration (20 m/s to 0 in 6 s)
S3 = ≤ft() × 6 = 1o x 6 = 60m
Total Distance, 50 + 200 + 60 = 310 m
A bus is travelling at 36 km h-1 when the driver sees an obstacle 30 m ahead. The driver takes 0.5 seconds to react before pressing the brake. Once the brake is applied, the velocity of the bus reduces with constant acceleration of 2.5 ms2. Will the bus be able to stop before reaching the obstacle?
Answer:
Unit Conversion
36 km/h = 36 × ≤ft() = 10 m/s
Step 1: Distance covered during reaction time
Reaction Distance, s1 = u x t = 1o m/s × 0.5, s = 5 m
Step 2:
Braking Distance
Given, u = 10 m/s, u = O
a = -2.5 m/s2
Using,
ν2= u2+ 2as
02= 102+2 (- 2.5)s2
O = 100 – 5s2
5s2 = 100 ⇒ s2 = 20 m
Total Stopping Distance, 5 m + 20 m = 25 m
Since 25 m < 30 m. Yes, the bus stops safely.
A student said, “The Earth moves around the Sun”. In this context, discuss whether an object kept on the Earth can be considered to be at rest.
Answer:
Rest and motion are relative concepts depending on the observer’s frame of reference. ‘With respect to the Earth’s surface (e.g., a room or the ground), the object is at rest. However, if the frame of reference is the Sun or space, the objeçt is in motion because it is moving along with the Earth in its orbit.
The velocity-time graph from 0 s to 120 s for a cyclist is shown in Fig. 4.30. Shade the areas (in different colours) representing the displacement of the cyclist
(i) while the cyclist is moving with constant velocity.
(ii) when the velocity of the cyclist is decreasing.
Also, calculate the displacement and average acceleration in the 120 s time interval.
Answer:
Shading the Areas:
1. Constant Velocity: Shade the rectangular area between t =20 s and t = 100 s
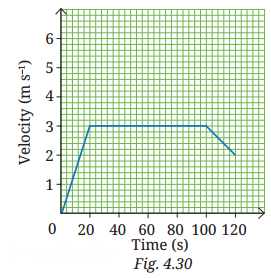
Decreasing Velocity: Shade the trapezoidal area between t = 1oo s and t = 120 s (where the line slopes downward).
Displacement Calculation (Total Area under the Graph):
Area 1 (Triangle, 0-20s): × 20 × 3 = 30m
Area 2 (Rectangle, 20 – 100s):
length × width = 80 × 3 = 240 m
Area 3 (Trapezium, 100 – 120s):
× (3 + 2) × 20 = 50m
Total Displacement: 30+240+50 = 320 m
Average Acceleration =
= m/s2
A girl is preparing for her first marathon by running on a straight road. She uses a smartwatch to calculate her running speed at different intervals. The graph (Fig. 4.31) depicts her velocity versus time. Estimate the distance she ran based on the graph.
Phase 1 (0 – 1.5 h): Approx. average
velocity is 7.1 km/h.
Distance ≈ 7.1 × 1.5 = 10.65 km
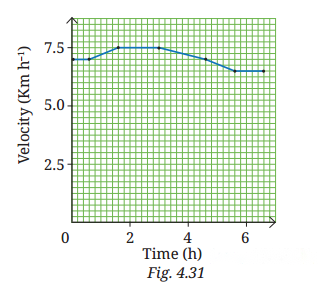
Phase 2 (1.5 – 3 h):
Constant velocity: 7.5 km/h.
Distance 7.5 × 1.5 = 11.25 km
Phase 3 (3 – 5.5 h): Velocity drops from
7.5 to 6.5. Average ≈ 7.0 km/h
Distance 7.0 × 2.5 = 17.25 km
Phase 4 (5.5 – Th): Constant velocity is 6.5 km/h.
Distance ≈ 6.5 × 1.5 = 9.75 km
Total Estimated Distance:
10.65 + 11.25 + 17.5 + 9.75 ≈ 49.15 km
On entering a state highway, a car continues to move with a constant velocity of 6 ms-1 for 2 minutes and then accelerates with a constant acceleration 1 ms-2 for 6 seconds. Find the displacement of the car on the state highway in the 2 min 6 s time interval by drawing a velocity-time graph for its motion.
Answer:
Given:
Constant velocity
v = 6m/s for
2 minutes = 120 s
Then acceleration
a = 1 m/s2for 6s
Displacement during constant velocity (first 120 s)
s1 = ν × t=6 × 120 =720m
Displacement during acceleration (next 6s)
Initial velocity, u = 6 m/s
s2 =ut+ at2 = 6 × 6+ × 1 × 62
= 36 + 18= 54m
Total Displacement
s = s1 + s2= 720 + 54 = 774m
Velocity- Time Graph Explanation
From 0 to 120 s → horizontal line at 6 m/s (constant velocity)
From 120 to 126 s → straight sloping line, uniform acceleration from 6 m/s to
12 m/s
Displacement = area under the graph (rectangle + trapezium)
Two cars A and B start moving with a constant acceleration from rest, in a straight line. Car A attains a velocity of 5 ms-1 in 5 s. Car B attains a velocity of 3 ms-1 in 10 s. Plot the velocity-time graphs for both the cars on the same graph. Using the graph, calculate the displacement in the two time intervals mentioned (Hint: Calculate the acceleration in both cases. Then calculate their velocities at five instants of time to plot the graph).
Answer:
Car A : a = ≤ft()=≤ft() = 1 m/s2
Car B : a = ≤ft() = 0.3 m/s2
Displacements:
Car A (in 5s) : s = × 5 × 5= 12.5 m
Car B (in 10s) : s = × 10 × 3 = 15 m
Rohan studies science from 6 PM to 7:30 PM at home. Consider the tip of the minute hand of the wall clock. During the given time interval, what is its:
(i) distance travelled,
(ii) displacement,
(iii) speed, and
(iv) velocity.
The length of the minute’s hand is 7 cm (Fig. 4.32).
Answer:
Given Data
Length of minute hand (r): 7cm
Time interval: 6:00 PM to 7:30 PM = 90 mins = 5400 s
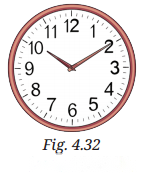
Rotations: In 90 minutes, the hand completes 1.5 circles.
(i) Distance is the total (circumference) covered
Distance = 1.5 × (2πr)
Distance = 1.5 × 2 × × 7
= 1.5 × 44 = 66 cm
(ii) Displacement is the straight-line distance from the start (12 O’clock) to the end (6 0’ clock)
This is equal to the diameter of the clock
Displacement = 2 × 7 = 14 cm
(iii) Speed =
Speed = = 0.733 cm/min
in cm/s: = cm/s
(iv) Velocity =
Velocity= = 0.155cm/min
= cm/s
Class 9 Science Chapter 4 Describing Motion Around Us Question Answer (InText)
Think It Over (NCERT Textbook Page No. 48)
How much distance should we maintain from the truck ahead to avoid a collision if it suddenly applies brakes?.
Answer:
When the truck ahead applies sudden brakes, it will still travel some distance before stopping (called stopping distance or braking distance). This distance depends on the speed at which the truck is moving and its deceleration. Our own vehicle will also take some distance to stop after we react and apply the brakes. This reaction time adds more distance. So we must maintain a safe distance that is at least equal to the sum of our vehicle’s braking distance plus our reaction distance.
Does this distance depend on the speed with which we are moving?
Answer:
Yes, the distance increases with speed.
Think It Over (NCERT Textbook Page No. 48)
Isn’t motion in nature wonderful? But how do we study the wide variety of complex motions around us?
Answer:
Yes, motion in nature is wonderful; seen in flowing water, flying birds, moving clouds, etc.
Think It Over (NCERT Textbook Page No. 49)
How do we describe the position of an object?
Answer:
Position is described using a reference point and distance (with direction) from it.
Pause and Ponder (NCERT Textbook Page No. 51)
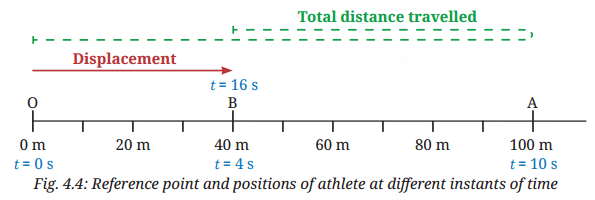
In the example of an athlete running back and forth on a straight track (Fig. 4.4), when will the displacement of the athlete be zero? What will be the total distance travelled in that case?
Answer:
The displacement of the athlete will be zero when the athlete returns exactly to the starting point O. In that case, the starting position and ending position are the same, so the net change in position is zero. The total distance travelled in that case will be the total path covered, which is OA + AB + BO = 100 + 60 + 40 = 200 m (if they return to O from B).
Note that total distance is not zero even though displacement is zero.
Fuel used up in a vehicle depends on which of the following? Justify your answer.
(i) Total distance travelled
(ii) Displacement
Answer:
(i) Fuel used up depends on the total distance travelled. The engine consumes fuel continuously as it covers the actual path.
(ii) A round trip has zero displacement but burns fuel covering the total distance.
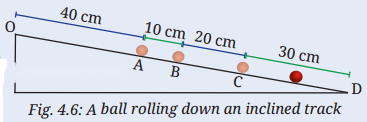
A ball rolls down an inclined track as shown in the figure. Is its motion a straight-line motion? Assuming the starting point of the ball (O) to be the origin, can its motion from O to D be depicted using a horizontal line as shown in the figure? Are the values of total distance travelled and magnitude of displacement from O equal or different at positions A, B, C, and D?
Answer:
The motion is not a straight-line motion because the path is curved (inclined track). Total distance and displacement are different at positions A, B, C, and D. Distance is along the curved path, while displacement is the straight line from O to each point.
Pause and Ponder (NCERT Textbook Page No. 53)
During a family road trip, you drive 200 km north in three hours. Afterwards, you drive 200 km south in two hours. Find the average speed and average velocity for your entire trip.
Answer:
Total distance = 200 km + 200 km = 400 km.
Total time = 3 + 2 = 5 hours.
Average speed =
=
= 80 km per hour.
Now for displacement: 200 km north, then 200 km south means you return to the starting point.
Net displacement = 200 – 200 = 0 km
Average velocity =
=
= 0 km per hour.
So the average speed is 80 kmh-1 but average velocity is 0 kmh-1.
Under what condition(s) is the:
(i) magnitude of average velocity of an object equal to its average speed?
(ii) magnitude of average velocity of an object zero while its average speed is not zero?
Answer:
(i) The magnitude of average velocity is equal to average speed when the object moves in a straight line without changing direction.
(ii) The magnitude of average velocity is zero, but average speed is not zero when the object returns to its starting point (displacement is zero, but distance is not zero).
Class 9 Science Chapter 4 Question Answer (Activities)
Activity 4.1:Let Us Analyse (NCERT Textbook Page No. 51)
Aim: To analyse the motion of a ball thrown vertically upward and understand the difference between total distance travelled and displacement.
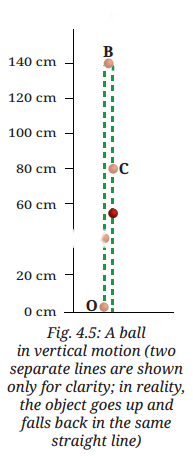
fig. 4.5: A ball in vertical motion (two separate lines are shown only for clarity; in reality, the object goes up and falls back in the same straight line)
Observations:
Yes. Even though the diagram shows two dotted lines for clarity, the text specifies that the ball moves up straight and falls back along the same path. This is a 1D (one-dimensional) motion.
To fill this out, we look at the positions on the scale:
o (0 cm), A (40 cm), C (80 cm), and B (140 cm).
- Distance is the total path length travelled.
- Displacement is the shortest straight-line distance between the starting point (O) and the current position, including direction.
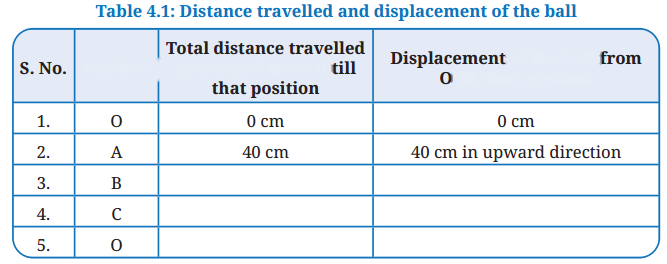
Position | Total distance travelled by the ball from O till that position | Displacement of the ball from O till that position |
1. 0 | 0 cm | 0 cm |
2. A | 40 cm | 40 cm in upward direction |
3. B | 140 cm | 140 cm in upward direction |
4. C | 200 cm(140 up + 60 down) | 80 cm in upward direction |
5. 0 | 280 cm (140 up+ 140 down) | 0 cm |
Note on Position C: When the ball falls back to C, it has travelled 140 cm to the top and then another 60 cm down (140-80 = 60). However, its displacement is only the distance from the origin (0) to its current spot (80).
Conclusion:
Looking at the data, we can conclude which statement is true for displacement: Statement (iii) is correct: Its magnitude is less than or equal to the total distance travelled.
Activity 4.2:Let Us Calculate (NCERT Textbook Page No. 55)
Aim: To calculate the magnitude of average acceleration of different types of cars using data collected from the internet, and compare their performances.
Observations: (Answer may vary)
Here is the complete data with table:
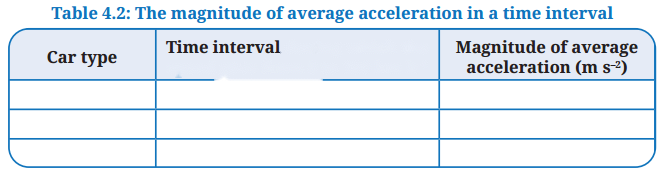
Table 4.2: The magnitude of average acceleration in a time interval
Car Type | Time interval (speed goes from 0 to 100 km/h) | Magnitude of average acceleration (m/s2) |
Rimac Nevera (Electric Hypercar) | 1.81 s | 15.35 m/s2 |
BMW M3 Competition (Sports Sedan) | 3.5 s | 7.94 m/s2 |
Common Hatchback (Typical Daily Car) | 10.5 s | 2.65 m/s2 |
Here, these were calculated:
To get the acceleration in m/s2, we convert the final speed (100 km/h) to m/s first:
1oo km/h = = 27.78 m/s
Then, we use the formula:
a =
Conclusion:
Rimac Nevera: 27.78/1.81 = 15.35 m/s2
BMW M3: 27.78/3.5 = 7.94 m/s2
Hatchback: 27.78/10.5 = 2.65 m/s2
Activity 4.3:Let Us Plot A Graph (NCERT Textbook Page No. 57)
Aim: To plot a position-time graph for a uniformly moving vehicle using data from a table, and learn how to read and interpret such graphs.
Observations:
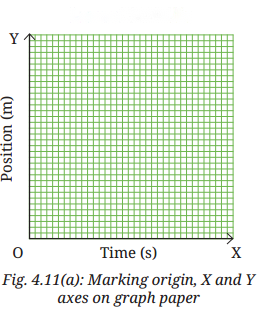
Activity 4.3 guides you through the process of visualising motion by plotting a Position-Time Graph.
Based on the steps provided in the images and the data visible in Figure 4.11(c), here is the complete analysis of the activity. From the plots in Figure 4.11(b) and 4.11(c), we can reconstruct the data table used for this activity.
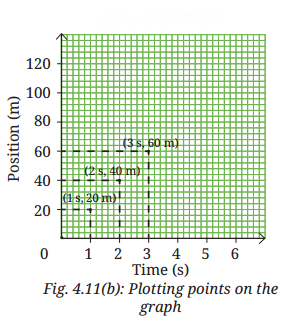
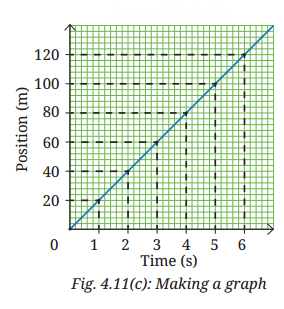

Time (s) | Position (m) |
0 | 0 |
1 | 20 |
2 | 40 |
3 | 60 |
4 | 80 |
5 | 100 |
6 | 120 |
By following the steps to connect the points, we observe the following:
Nature of the line: The graph is a straight line passing through the origin.
Type of Motion: Because the position increases by equal amounts (20 m) in equal intervals of time (1s), this represents Uniform Motion.
Slope Calculation: The “steepness” or slope of this line represents the velocity of the vehicle.
Slope= {Change in Position }{Change in Time }={(120-0) m}{(6-0) s} = 20 m/s
Conclusion:
To complete the activity in your notes, you should record these final observations:
Direct Proportionality: The position is directly proportional to time (x ∝ t)
Constant Velocity: Since the slope of the position-time graph is a straight line, the vehicle is moving at a constant speed of 20 m/s.
Predictive Power: Using this graph, you can now find the position at any time. For example, at t = 3.5 s, you can draw a vertical line up to the graph and see that the position would be 70 m.
Activity 4.4:Let Us Calculate (NCERT Textbook Page No. 59)
Aim: To calculate the average velocity of a moving vehicle from its position-time graph by finding the slope of the line.
Observations:
Figure 4.14, we select two points on the line, A and B. By drawing lines parallel to the axes, we form a right-angled triangle ABC.
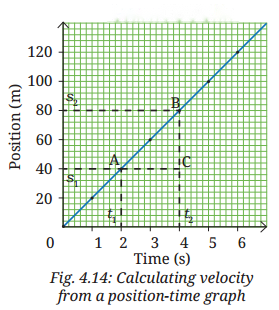
Side BC: Represents the change in position (s2 – s1). Looking at the y-axis, this is 80m – 40m = 40m.
Side AC: Represents the change in time
(t2– t1). Looking at the x-axis, this is 4 s -2 s = 2 s.
Average velocity (ν) is defined as the rate of change of position. Using the values extracted from the graph:
ν =
Substitute the numbers from the example:
ν = = 20ms-1.
Conclusion: The most important takeaway from this activity is the geometric interpretation of the graph:
The ratio BC/AC is called the slope of the line.
In a position-time graph, the slope equals the velocity.
If the line is steeper, it means the object is moving faster (higher velocity). If the line is horizontal, the slope is zero, meaning the object is at rest.
Activity 4.5:Let Us Investigate (NCERT Textbook Page No. 67)
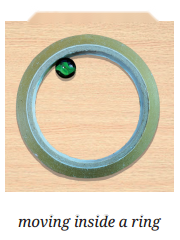
Aim: To investigate the direction of motion of an object moving in a circular path when it is suddenly released, demonstrating Newton’s First Law of Motion (inertia).
Observation: When the ring is lifted, the marble does not continue in a circular motion. Instead, it moves in a straight line tangential to the point where it was released.
Conclusion: The marble moves in a straight line. At every point in a circle, the object wants to move straight; the ring was providing the force to keep it turning. Once that constraint (the ring) is removed, the marble follows the direction it was headed at that exact instant.
CBSE 2026-27 Board Exam Preparation & Practice Papers
Free Chapter Notes & Question Bank by BoardExams.in