NCERT Solutions • Class 6 Mathematics (Ganita Prakash) |
Get the simplifiedClass 6 Maths NCERT Solutionsof Ganita Prakash Chapter 4 Data Handling and Presentation textbook exercise questions with complete explanations.
Ganita Prakash Class 6 Maths Chapter 4 Solutions Data Handling and Presentation
1 Collecting and Organising Data Figure it Out (Page No. 75 – 76)
Question 1
Solution:
To find the most popular game, we should create a table with two columns, one for the game name and one for the number of students who choose each game. By referring the Naresh’s and Navya’s list, for each game count how many students selected it and record that number in the table. The game with the highest count will be the most popular game.
|
Question 2
|
Question 3
|
Question 4
|
1 Collecting and Organising Data Figure it Out (Page No. 76 – 77)
Question 1
Solution:
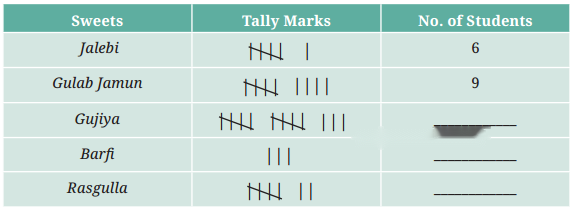
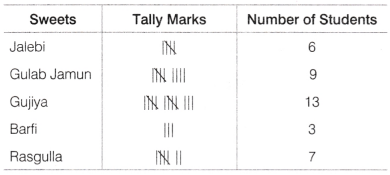
(a) It is clear from the table, 6 students chose Jalebi. (b) From the table, we can say that Barfi was chosen by 3 students; (c) 13 students chose the gujiya. (d) Rasgulla was chosen by 7 students. (e) 9 students chose gulab jamun. |
Question 2
|
1 Collecting and Organising Data Figure it Out (Page No. 77 – 79)
Question 1
|
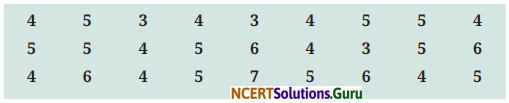
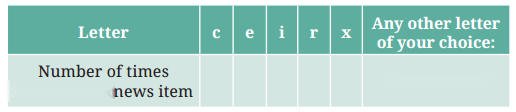
Sushri Sandhya asked her asked her students about the sizes of the shoes they wear. She noted the data on the board-
She then arranged the shoe sizes of the students in ascending order-
3, 3, 3, 4, 4, 4, 4, 4, 4, 4, 4, 4, 5, 5, 5, 5, 5, 5, 5, 5, 5, 5, 6, 6, 6, 6, 7
Question 2
|
Question 3
|
Question 4
|
Question 5
|
2 Pictographs Figure it Out (Page No. 83 – 84)
Question 1
Solution:
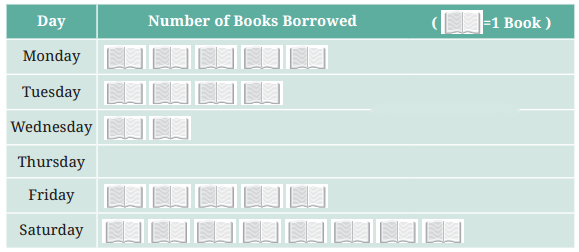
(a) The minimum number of books were borrowed on the day with the shortest bar or the fewest symbols in the pictograph. It is clear that number of Books borrowed on Thursday is zero.
(b) To find the total number of books borrowed during this week, add up the number of books represented by the symbol for each day. Here, total number of books = 24 (c) The maximum number of books were borrowed on Saturday because Saturday has the maximum number of symbols in the pictograph. |
Question 2
|


3 Bar Graphs Figure it Out (Page No. 88)
Question 1
Solution:
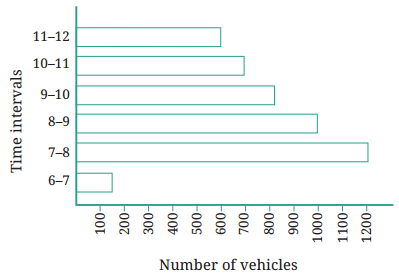
Total number of cars which passed through the crossing between 6 am and noon = 150 + 1200 + 1000 + 820 + 700 + 600 = 4470 (Refer the bar graph on page 87)
|
Question 2
|
Question 3
|
Question 4
|
4 Drawing a Bar Graph Figure it Out (Page No. 93-99)
Question 1
Solution:
To prepare a bar graph representing the given data, follow the point given below.
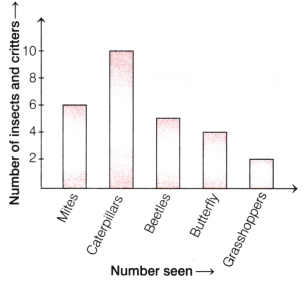
(i) Draw a horizontal axis (X-axis) labeled, ‘Insects/critters’ with each type of insect or critter evenly spaced (ii) Draw a vertical axis (Y-axis) labeled ‘Number seen’ with numbers starting from 0 up to the maximum number seen (in this case, 10) evenly spaced. (iii) For each insect or critter, draw a bar that rises to the number seen. For example, the bar of caterpillars should reach up to 2. |
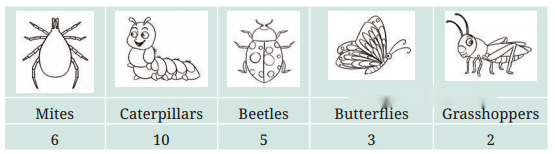
Required bar graph is given below.
Question 2
|

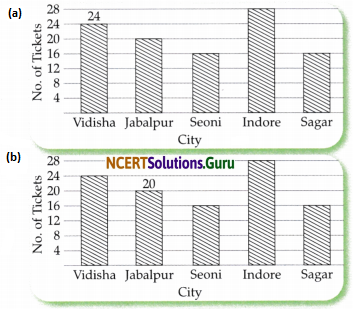
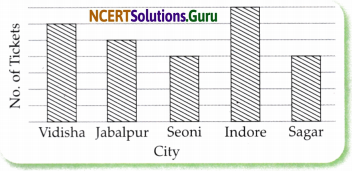
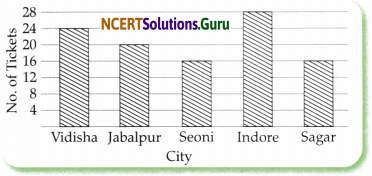
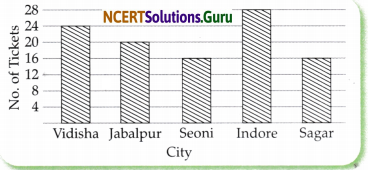
Question 3
|
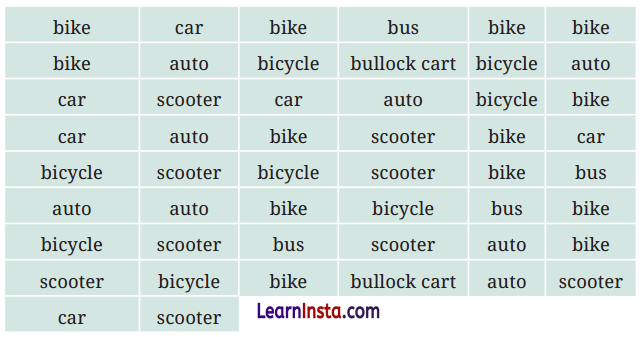
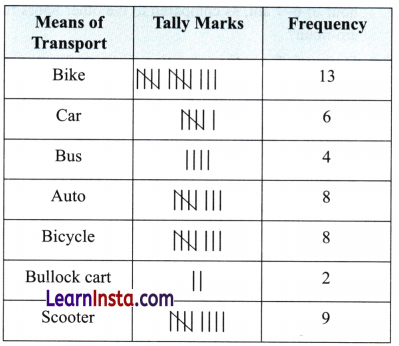
Question 4
|
Question 5
|
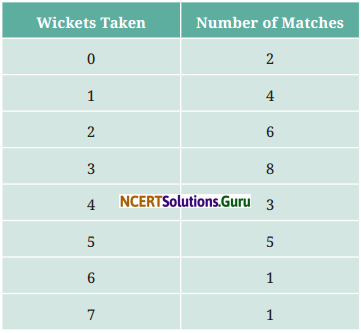
Question 6
|
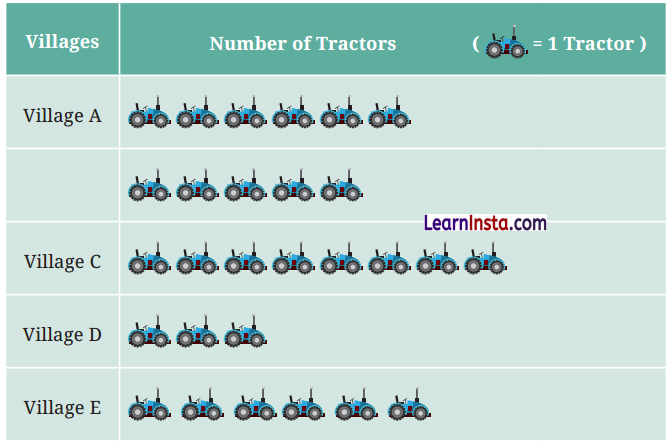
The following pictograph shows the number of tractors in five different villages.
Observe the pictograph and answer the following questions—
(a) Which village has the smallest number of tractors?
Solution:
Village D has the smallest number of tractors.
(b) Which village has the most tractors?
Solution:
Village C has the most tractors.
(c) How many more tractors does Village C have than Village B?
Solution:
Number of tractors village C has = 8
Number of tractors village B has = 5
Difference = 8 – 5 = 3
So, village C has 3 more tractors than village B.
(d) Komal says, “Village D has half the number of tractors as Village E.” Is she right?
Solution:
Number of tractors village D has = 3
Number of tractors village E has = 6
Clearly, village D has half the number of tractors as village E.
Hence, Komal is right.
Question 7
|
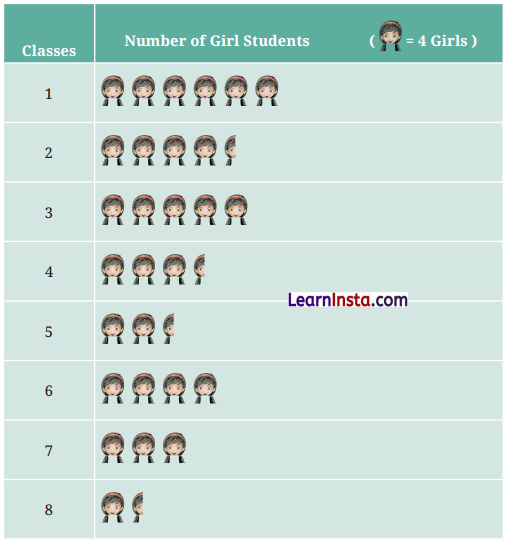
(b) What is the difference between the number of girls in Class 5 and 6?
Solution:
Number of girls in class 5 = 4 + 4 + 2 = 10
Number of girls in class 6 = 4 + 4 + 4 + 4= 16
∴ Difference = 16 – 10 = 6
(c) If 2 more girls were admitted in Class 2, how would the graph change?
Solution:
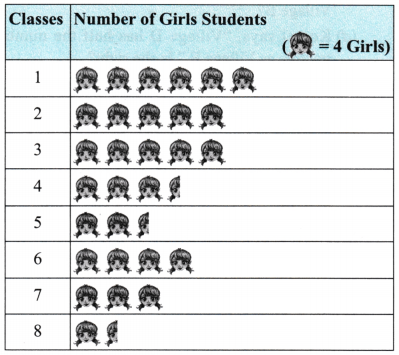
Number of girls in class 2 = 4 + 4 + 4 + 4 + 2 = 18
If 2 more girls are added, then,
Number of girls in class 2 = 18 + 2 = 20
Therefore, new graph would be:
(d) How many girls are there in Class 7?
Solution:
Number of girls in class 7 = 4 + 4 + 4 = 12
Question 8
|
(ii) Since, each symbol represents 6 dogs.
∴ Village B has 36 dogs.
∴ =6 symbols 6
H Hence, 6 symbols will be used to represent the dogs in village B.
(iii) Yes, Kamini is correct. The combined total number of dogs in village B and village D is (36 + 48) = 84 dogs.
∴ The total for other four villages is 72 dogs. Therefore, 84 is greater than 72.
So, Kamini is right.
Question 9
|
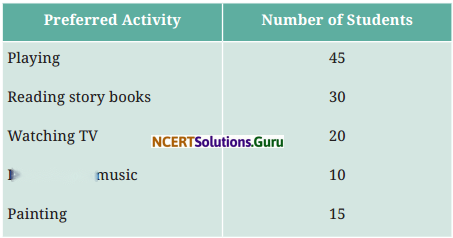
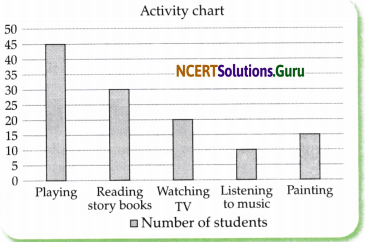
Question 10
|
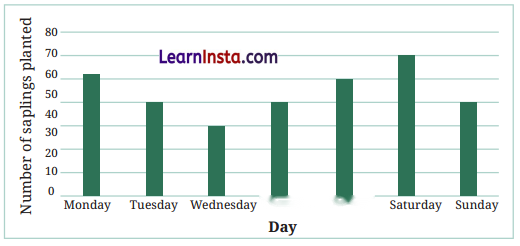
Question 11
|
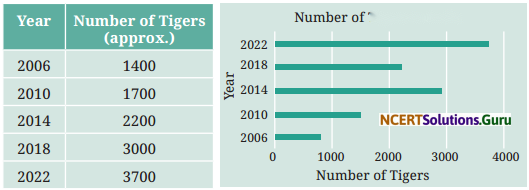
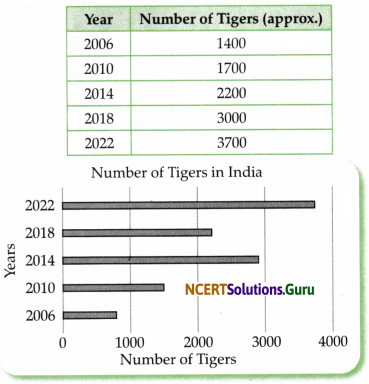
5 Artistic and Aesthetic Considerations Figure it Out (Page 103)
Question 1
Solution:
Do it by yourself.
|
Question 2
|
Intext Questions
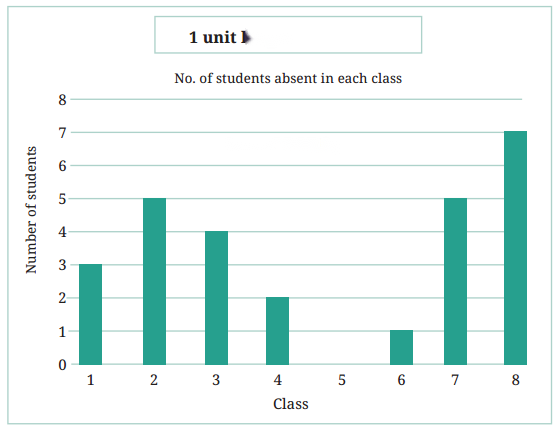
Question 1
|
Question 2
|
Question 3
|
CBSE 2026-27 Board Exam Preparation & Practice Papers
Free Chapter Notes & Question Bank by BoardExams.in