BoardExams.in
Class 7social scienceCBSE 2026-27

NCERT Solutions for Class 7 social science Chapter 2: Understanding the Weather Class 7

21 Solved Questions & Exercises10 min estimated readingUpdated 2026-09-16
Top Sponsor / Ad Space

CBSE 2026-27 Board Exam Preparation & Practice Papers

Free Chapter Notes & Question Bank by BoardExams.in

NCERT Solutions • Class 7 Social Science (Exploring Society)
Chapter 2: Understanding the Weather Class 7
Latest Rationalised Syllabus (NEP 2026-27)

Students can keepExploring Society India and Beyond Class 7 Solutionsand Class 7 Social Science SST Chapter 2 Understanding the Weather Question Answer NCERT Solutions handy for quick reference during exams.

Class 7 Social Science Chapter 2 Question Answer Understanding the Weather

NCERT Class 7 Social Science Chapter 2 Understanding the Weather Questions and Answers Solutions

Understanding the Weather Class 7 Question Answer (In-Text)

The Big Questions? (Page 27)

Question 1


How can we measure and monitor the weather around us?
Answer:
We can measure and monitor the weather using special instruments and tools. Here are some examples:

Question 2


How do weather predictions help us prepare for events like heavy rain, storms, drought and heat waves?
Answer:
Weather predictions give us advance information about upcoming weather events, which helps us prepare and stay safe. For example:

Let’s Explore

Question 1


What are some of the words in your local language that you use to describe the weather? Hot, cold, warm, chilly, crisp, pleasant and so on, are commonly used terms in English. (Page 28)
Answer:
In my local language, we have some unique and expressive words to describe the weather. Here are a few:

Question 2


What do you think could be some other reasons to measure the weather more precisely? (Page 29)
Answer:
Yes, measuring the weather more precisely has many important reasons. Here are some of them:

Question 3


Talk to the elders in your neighbourhood and ask them how they predict the weather. What signs do they observe? Document any sayings in your regional language that refer to weather prediction. (Page 30)
Answer:
Do it yourself.

Question 4


(a) Here’s a chart of the temperatures of a city in Madhya Pradesh. What is the maximum temperature recorded in the week shown here? What is the minimum temperature? Calculate the range. (Page 32)

Date

Maximum Temperature (in °C)

Minimum Temperature (in °C)

Question 1 (28)

02.2025

29

16

01.03.2025

30

15

02.03.2025

31

17

03.03.2025

32

18

04.03.2025

30

17

05.03.2025

28

14

06.03.2025

29

15

Solution:
Maximum temperature recorded in the week: From the chart, the highest maximum temperature is 32°C (on 3.3.2025).
Minimum temperature recorded in the week: The lowest minimum temperature is 14°C (on 5.3.2025).
Temperature range: Range = Maximum temperature – Minimum temperature = 32°C – 14°C = 18°C

(b) Remember the conservation between Krishnan and Amir? If Krishnan said it was 20 degree Celsius in Chennai and that he was feeling a little cold, both he and Amir would have a measure they could understand. What do you think Amir’s reaction to Krishnan’s statement might be? (Page 33)
Answer:
If Krishnan said it was 20°C in Chennai and that he was feeling a little cold, Amir might be surprised and say something like:
“Really? 20 degrees is quite comfortable here! In Madhya Pradesh, we only start feeling cold when it’s much lower than that.”
This highlights how climate and personal experience influence how we perceive temperature. Chennai has a hot and humid climate most of the year, so 20°C can feel cool to someone used to higher temperatures. Meanwhile, someone from central or northern India, like Amir, might find it quite normal or even warm.

Question 5


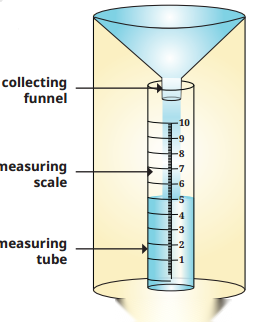
Make a rain gauge as shown in the below diagram. Place the rain gauge in an open area, away from objects that might obstruct rain. Ensure that the rain gauge is on a flat surface and will not tilt or topple with the wind. Using the measuring scale, record the amount of rainwater collected at the same time every day, for a month. (If there is snow, allow it to melt before taking the measurement.) Calculate the average rainfall for every week in that month and comment on the variation from week to week. (Page 34)

Answer:
Do it yourself.

Understanding the Weather Class 7 Diagram 1

Question 6


Where do you think the humidity is likely to be more, Kochi or Jaipur? You might guess that Kochi has higher humidity than Jaipur because it is located near the sea. But how will we know for sure? If we had to compare the humidity level between Kochi and Mangaluru, how would we do it? Discuss with your classmates. (Page 37)
Answer:
Do it yourself

Question 7


Discuss in pairs, different situations in which weather predictions are useful. Make a list and after you have completed your list, share it and discuss it with the pair sitting next to you. How many different categories of situations have you been able to identify? (Page 41)
Answer:
Do it yourself.

Question 8


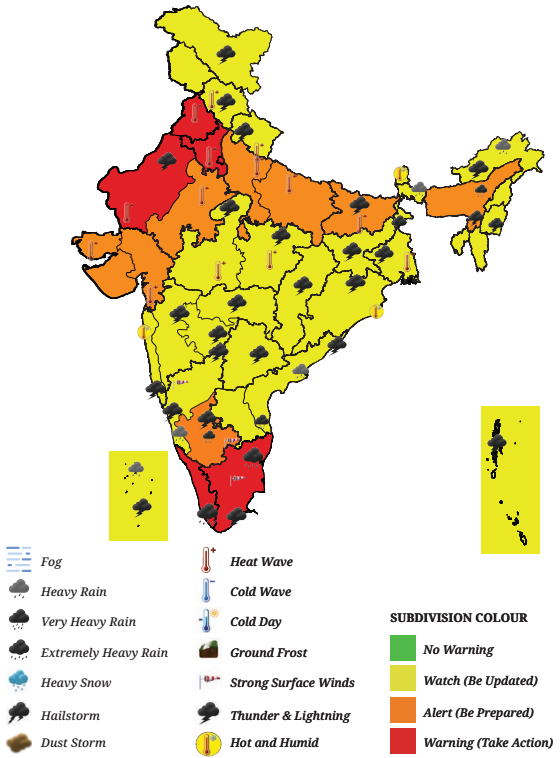
Look carefully at the below map. (Page 40-41)

(i) What do you observe happening on that day (19 May 2024)? What are the various weather conditions that the IMD is alerting people to?
Answer:
On 19 May 2024, the IMD issued alerts for:

Understanding the Weather Class 7 Diagram 2

(ii) Which state has warning sign?
Answer:
States under red alert or significant warnings on 19 May 2024 included:

(iii) Which parts of India are likely to be free from any severe weather?
Answer:
Regions likely to experience normal weather conditions without severe alerts included:

(iv) Which states are likely to face heat wave conditions?
Answer:
States forecasted to experience heatwave or severe heatwave conditions included:

(v) What are causes for warning in Tripura and Lakshadweep?
Answer:

Think About it (Page 29)

Question 1


Let us imagine Krishnan from Chennai is speaking with Amir in Kashmiri. Krishnan tells Amir that it has become chilly in Chennai after it rained the previous night. Amir asks him how cold it is. How will Krishnan explain to Amir how cold it is? After all, what is cold for Krishnan may not be cold for Amir?
Answer:
Krishnan, who lives in Chennai, tells Amir from Kashmir that it has become chilly after it rained the previous night. When Amir asks how cold it is, Krishnan explains that the temperature has dropped to around 22°C, which feels quite cold for people in Chennai. He says that they are used to hot and humid weather most of the year, so even a small drop in temperature feels chilly. He might even mention that he had to wear a light sweater in the morning. Amir, coming from Kashmir where winter temperatures can go below 0°C, finds this surprising. For him, 22°C is quite pleasant and not cold at all. This shows that what feels cold or warm can be different depending on the climate people are used to.

Question 2


Why do you think it would be important to measure the atmospheric pressure? Who are the people most likely to use such measurements? (Page 35)
Answer:
It is important to measure the atmospheric pressure:

Such instruments are used by:

Question 3


People who journey to places at a high altitude are advised to make pause on the way to allow the body to acclimatise. Our army personnel serve in high- altitude places like Khardungla in Ladakh, which is over 5600 metres above sea level. It is hard to image how they live and work in places where the oxygen level is so low – the atmospheric pressure there is generally about 650 millibars! (Page 35)
Answer:
The army personnel live in:

For most people, living at such high altitudes is unimaginable because we are used to normal oxygen levels and comfortable temperatures. The idea of surviving in freezing cold, with little oxygen, and performing physically demanding tasks is a testament to the bravery and dedication of army personnel.

Question 4


Have you seen seeds like these flying in the wind (see the below image)? What would happen to the seeds if there was no wind? (Page 36)

Answer:
If there was no wind, the seeds would not be able to spread far from the parent plant. Most wind- dispersed seeds would fall right below the plant that produced them. This would cause the plants to grow very close to each other, leading to competition for sunlight, water, and nutrients. Some seeds might not grow at all because there would not be enough space or resources. Without wind, seeds would not reach new places to grow, and this would reduce the number of new plants in different areas. Over time, some types of plants might even disappear because they cannot spread their seeds properly.

Understanding the Weather Class 7 Diagram 3

Question 5


If the humidity in Delhi is at 52% while in Kochi it is 84% in which of the two places are wet clothes likely to dry faster? And where are you likely to sweat more, assuming the temperature in the same in both places? (Page 38)
Answer:
If the humidity in Delhi is 52% and in Kochi it is 84%, here’s what would happen:

Class 7 SST Chapter 2 Understanding the Weather Question Answer (Exercise)

Question 1


Match the instrument with the weather element it measures.

Instrument used

Element of the Weather

Question 2 (1)

Hygrometer

(a) Precipitation

2. Anemometer

(b) Atmospheric pressure

3. Barometer

(c) Wind direction and speed

4. Thermometer

(d) Humidity

5. Rain gauge

(e) Temperature

Solution:
s:

Instrument used

Element of the Weather

1. Hygrometer

(d) Humidity

2. Anemometer

(e) Temperature

3. Barometer

(b) Atmospheric pressure

4. Thermometer

(c) Wind direction and speed

5. Rain gauge

(a) Precipitation

Question 2


Jyotsna is deciding what clothes to pack for her school trip to Mumbai in June. She looks at the weather forecast, which predicts 29°C and 84% humidity. What would be your advice to her?

Solution:
Since Jyotsna is going to Mumbai in June, and the forecast shows 29°C with 84% humidity, here’s some advice for her:
Question 3


Imagine that a small group of students is setting up a rain gauge. Here are some options for the site.
(i) The school vegetable garden.
(ii) The terrace of the school building.
(iii) Open ground with elevated platform.
(iv) Compound wall of school.
(v) Verandah of the school laboratory.
Discuss in your group and finalise the site. Write down the reasons for your decisions.
Answer:
Do it yourself.

Question 4


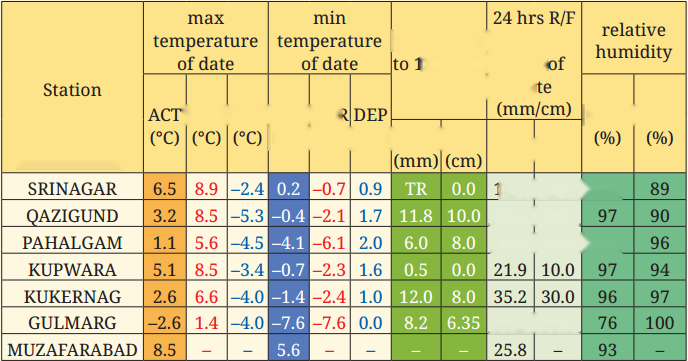
Below is a chart taken from IMD, Jammu and Kashmir. Looking at the data available, write a short script to report the weather conditions in different parts of Jammu and Kashmir on the data shown. (Hint: Cover the temperature range, maximum and minimum temperatures, humiditys, precipitation, etc.)

Daily weather parameters jammu & kashmir (evening) date: 01-02-2024

Answer:
Do it yourself
Understanding the Weather Class 7 Diagram 4

In-Article Ad Slot

CBSE 2026-27 Board Exam Preparation & Practice Papers

Free Chapter Notes & Question Bank by BoardExams.in